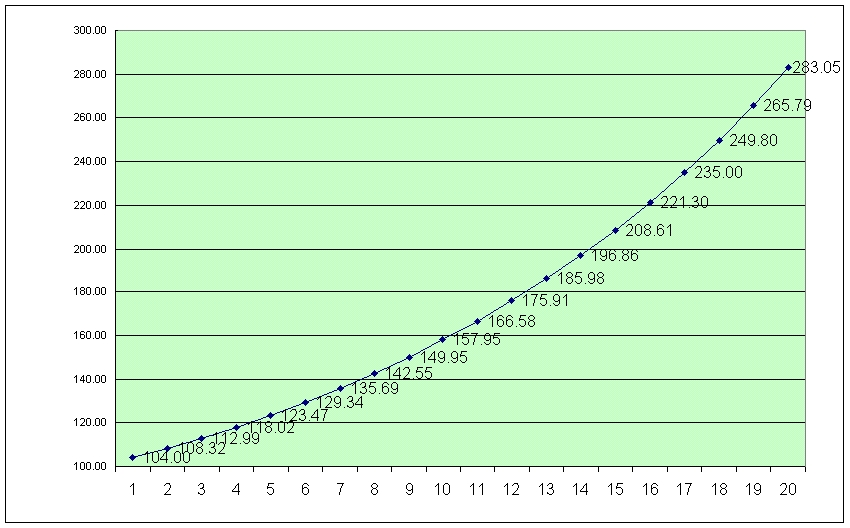
Equity Graph
This Graph shows: 1) The Equity Investment returns 11% annually. 2)$100 is the start value; appreciating to $283.05 after 20 years. 3)$4 is deducted each year to represent an income need; inflation is 3% annually.
Return to HOME page